COVID-19 Modeling Pt. 4

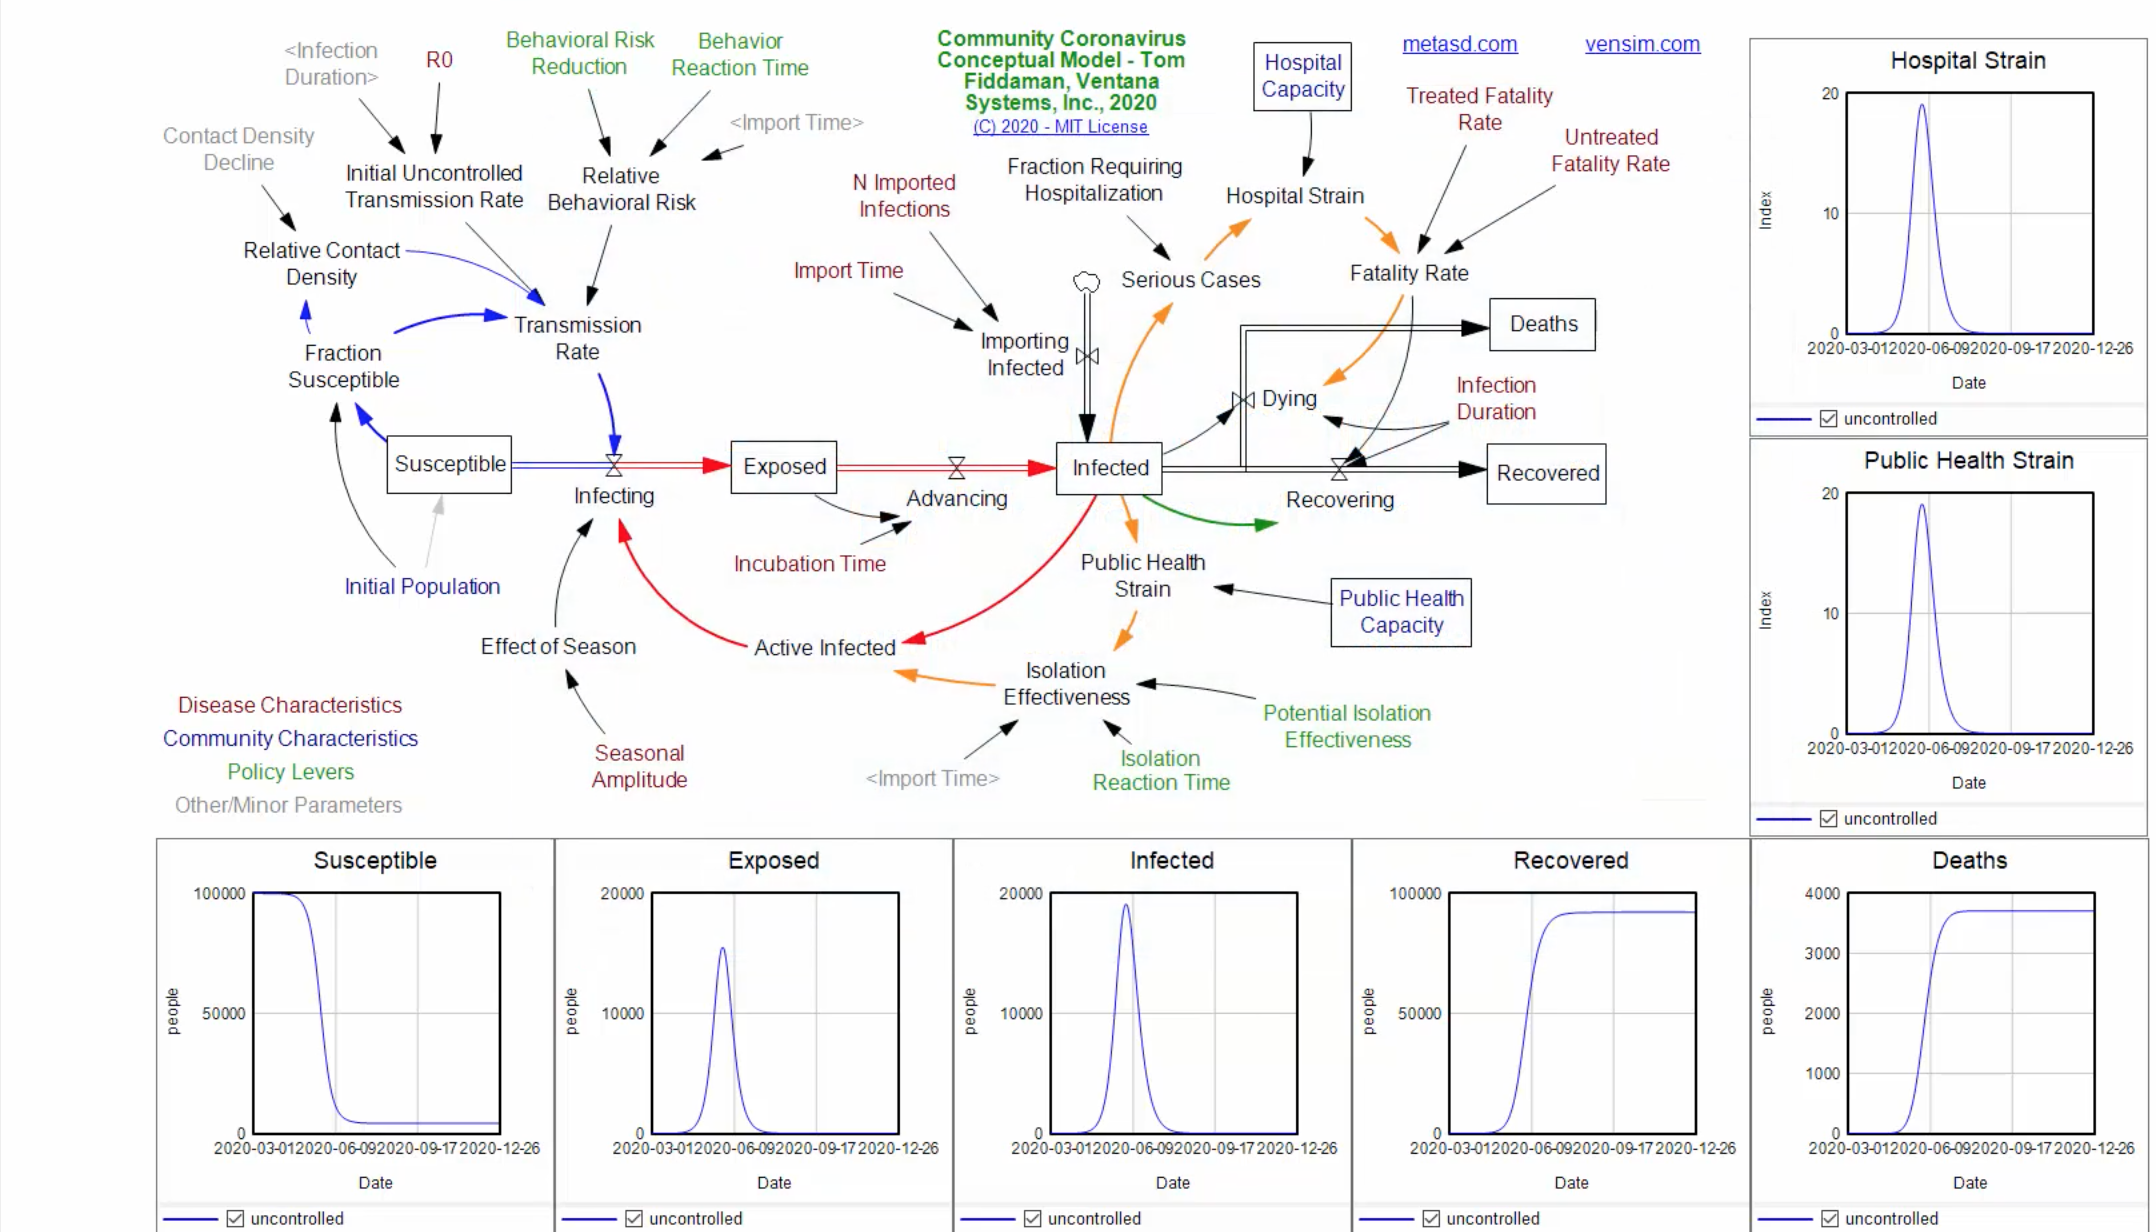
In my previous post, I discussed models that can be used to forecast the future behavior of the pandemic. One of the limitations of these models is that they are complex and need to be recalibrated or updated frequently. What would be helpful is an analysis technique that would allow us to monitor various factors on a daily basis to know when a change in the situation is likely. For this purpose, we turn our attention to an approach known as Statistical Process Control (SPC) which was introduced to the industrial community by Walter Shewhart in the mid-1920s.

In SPC, the amount of variation that has transpired over time is used to derive upper and lower limits of activity expected. Unlike other statistical approaches, SPC accounts for the notion that processes happen over time, and in addition to the variability that is seen in the aggregate data, it is important to consider the amount of variability in the data over time. This is best understood by looking at an example. The following SPC chart depicts the daily count of COVID-19 deaths for the state of North Carolina.

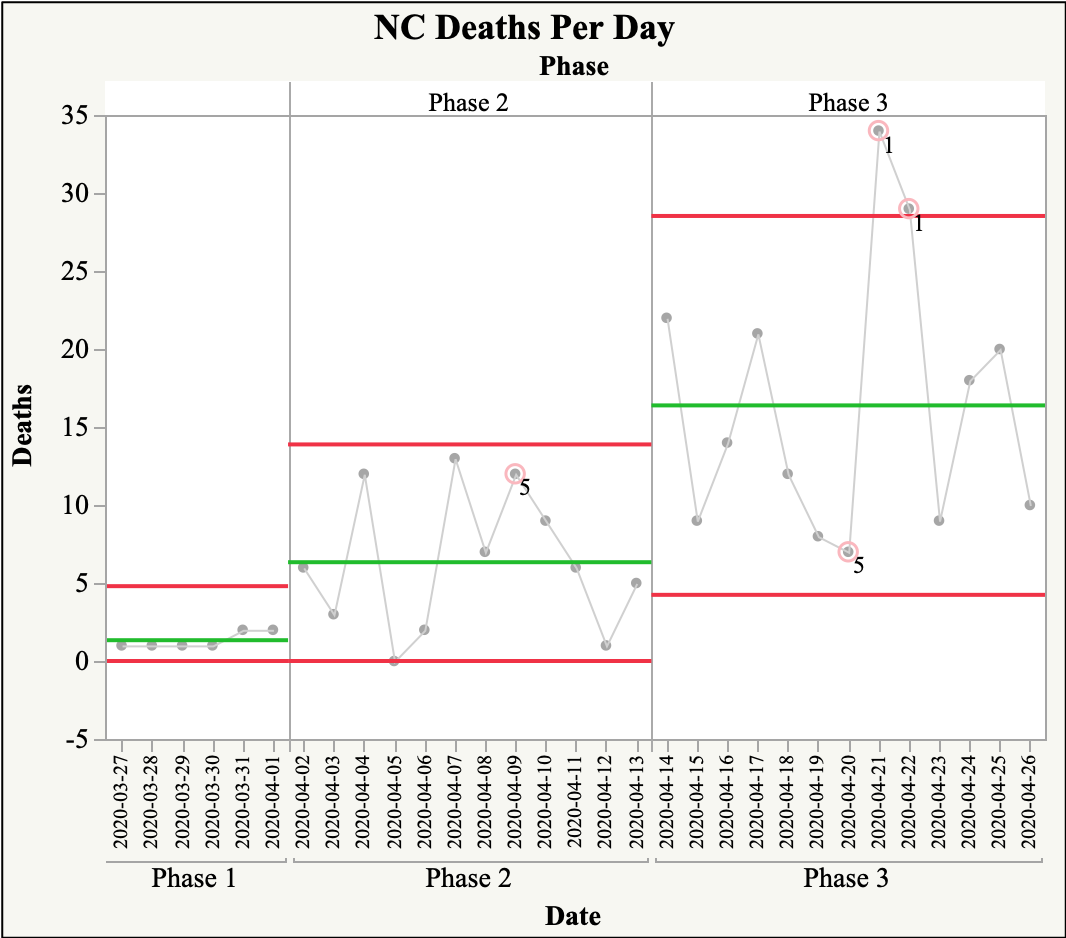
As you can see, there are points that are beyond the upper control limit in Phase 3. These points are referred to as special cause points. These points are beyond the range of deaths which might be expected currently. For these points, it would be appropriate to question whether there was a specific precursor that caused these results. With there being so many factors that could lead to these spurts it may not be possible to identify a specific cause. However, that does not detract from our ability to understand the amount of variation which may be expected in the count of daily death, which could help policymakers from reacting to changes too quickly.

Another type of SPC chart that can be used to provide valuable information to policymakers during the time of a pandemic is one that is based on rates such as the example below.

This later chart can be useful when trying to compare multiple rates as it controls for the number of opportunities or sample size, and as such is a more equitable way of comparing multiple rates.

Over the past four posts, I have described a number of models that can be used to assess the trajectory and health impact of COVID-19. As is evident from these discussions, there is a great deal of variability in the data related to this pandemic and an assortment of factors to consider when interpreting this data. With this in mind, it is important to consider all of these factors before making a decision regarding the reopening of communities. In future posts, I will begin to look at some of the actions that need to be taken as we reopen.

COVID-19 Modeling Pt. 3

In my last post, I mentioned the SIR (susceptibility, infected, and recovery) model that incorporates the interaction effect between variables. SIR models can range from simple models, such as the following:

To complex models, such as the SEIR (susceptibility, exposure, infected, recovered) Vensim simulation model. derived by Tom Fiddaman of Ventana, the SEIR is an example of a complex system dynamics approach to modeling. The benefit of advanced SIR or, in this case, SEIR models are that they allow policymakers to simulate the impact of various policy actions. For example, it is possible to simulate how social distancing might move the curve of infected individuals to a later period, and better understand how social distancing might impact the number of deaths resulting from overwhelmed healthcare systems.


While all the models described to this point can help policymakers or community leaders forecast and consider “what-if” scenarios, they do not do an excellent job of helping to determine if variables of interest, such as if the number of cases or number of deaths is beginning to decline. In this situation, what is needed is a tool which will make it easy to determine if contiguous areas should receive extra assistance or if a community is ready to reopen. In the next post, I will describe some industrial methods which can help with these types of issues. Until next time, remember to protect yourself which also helps protect your neighbors and community.

COVID-19 Modeling Pt. 2

In the last post, I presented a COVID-19 model in which a curve-fitting model was used to fit the number of COVID-19 cases in North Carolina. One of the problems with modeling the number of COVID-19 cases at this early stage is that it is nearly impossible to know with any degree of certainty how many individuals were exposed but had minimal to no symptoms, and have not been tested. A recent Stanford University study suggests that the current count of cases may only represent 20-50% of the total number of individuals that have been exposed. For this reason, models of the number of deaths may be more useful in guiding reopening decisions.

The following is a Gaussian Peak model of the number of reported COVID-19 deaths for the state of North Carolina as of April 18, 2020. Based on this model, it appears that the state of North Carolina will not reach a peak in the number of deaths due to COVID-19 until around May 1st. What is interesting is that based on this model, deaths will peak at the same time as the expected cases derived in the previous model. Based on the Stanford study referenced above, this would suggest the fatality to cases rate is much lower than projected. This does not negate the fact that there has been a significant number of deaths, instead, it simply suggests that more individuals than originally thought have been exposed to the virus.

Unfortunately, there are limitations to the models presented up to this point. One important limitation is that they do not allow for ‘what-if” scenarios. In the current COVID-19 environment, policymakers at all levels continue to struggle with “stay-at-home” orders, social distancing, and reopening decisions. What would help would be a model which allows policymakers to test different actions to see how they may influence the spread of COVID-19. Luckily, epidemiological models exist for this very purpose. The simplest of these is the SIR model.

In the next post, I will elaborate on the SIR model and the slightly more complex SEIR model which is designed to taking into consideration the interaction between factors such as the number susceptible, the number inflected, and the number of people recovering.